Opens a separate, ad-free editor in a new tab. Choose your file there; the editor processes it in your browser.
Edit slides 1–20 free.Preview the whole deck. Slides 21 onward remain unchanged in your download.Planned full version: $4.99 one-time. Purchases and unlocking are unavailable.
01 / WRITE FOR THE CONTEXT
A description starts with the slide, not the filename.
These examples use an original synthetic photo and invented chart data. They contain no course material or research findings.
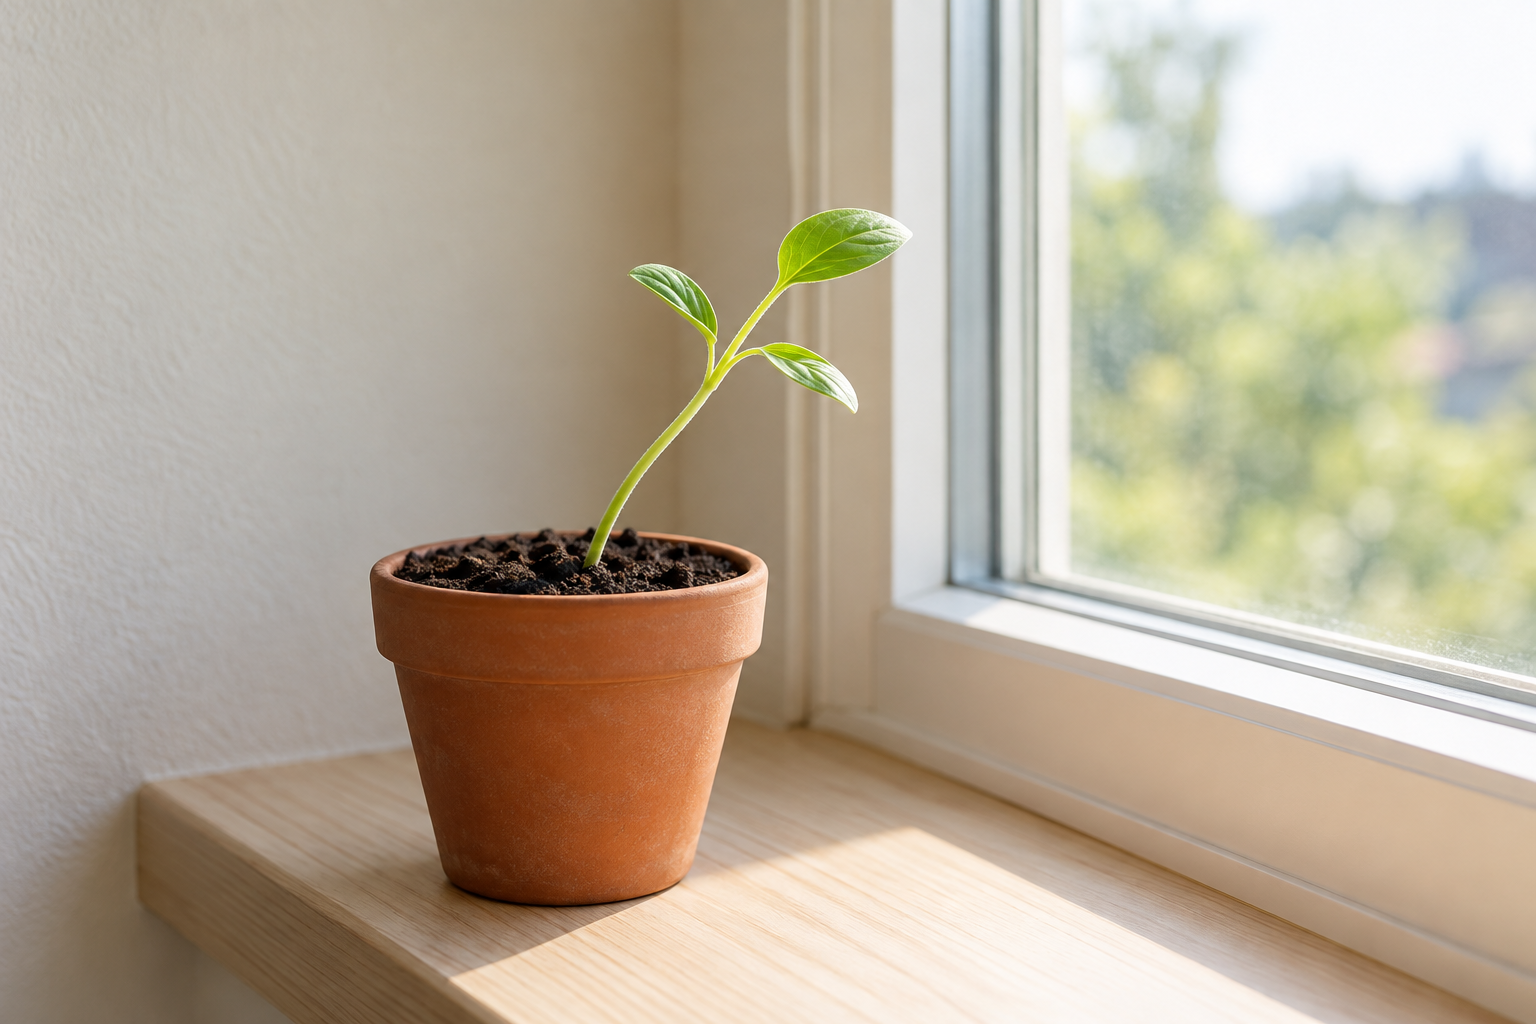
Original AI-generated illustrative photo. It does not document an experiment.
Photo · practice slide 1
Observe the direction of growth
Slide purpose: notice which way the stem leans.
Before
Plant photo
Better for this slide
A seedling’s stem leans right toward a bright window.
The revision identifies the visible relationship. “Plant photo” names the subject without giving the observation the slide needs. Do not claim the photo proves a cause or a treatment effect.
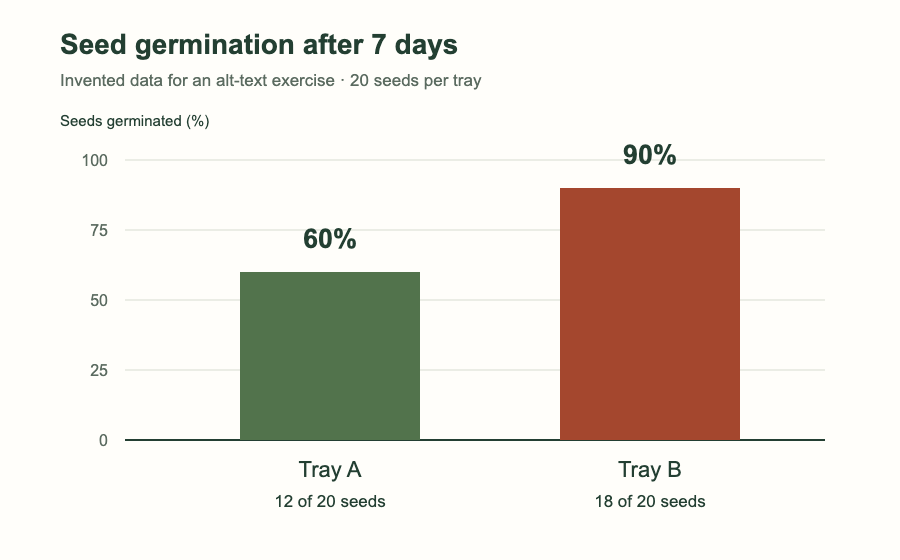
Original chart with invented practice data; both trays start with 20 seeds.
Chart image · practice slide 3
Compare two trays after 7 days
Slide purpose: compare the germination counts and proportions.
Before
Chart
Better for this slide
After 7 days, 12 of 20 seeds germinated in Tray A and 18 of 20 in Tray B: 60% versus 90%. These are invented practice data.
Tray B has six more germinated seeds: a difference of 30 percentage points. The description preserves the values and time window; naming the bar colors alone would miss the comparison.
Make the essential data available as text
This two-bar chart is simple enough to describe in a sentence. For a dense chart, give the takeaway and make the essential values available in an accessible table or longer description alongside it. Do not promise a table that your slide does not contain.
Does the text convey what the image contributes to this slide?
Have you included the relevant direction, relationship, labels, or values?
Have you avoided guessing facts the image and slide do not establish?
Will the same words make sense for every selected occurrence?
For more on choosing an alternative based on purpose and context, see W3C’s image decision tree. Its HTML instructions are not PowerPoint controls.
02 / TRY THE WHOLE WORKFLOW
Six slides. Five pictures. A safe place to practice.
Download this synthetic deck and open it in the editor. No account or payment is needed. The download does not automatically open or send a file to the editor.
About 1.7 MB each. The completed file is a comparison copy, not an automatic evaluation of your work.
What you will find when you open the practice deck
Slide
Title
Starting state
What to do
1
Observe the direction of growth
“Plant photo”
Describe the lean toward the window.
2
Set up an observation station
Missing description
Select with slide 4 for bulk apply.
3
Compare two trays after 7 days
“Chart” · picture of a chart
Add the values and time window.
4
Observation station reminder
Missing · picture inside a group
Use the same setup description as slide 2.
5
Pause for a question
Marked decorative · read-only
Review in PowerPoint; leave it unchanged here.
6
Native chart: work in PowerPoint
Native chart · outside picture list
Review the chart in PowerPoint.
Open and inventory the deck
In the editor, open alt-text-practice.pptx. Expect 6 slides, 5 images, 2 missing descriptions, 0 edited. Slide numbers follow presentation order. Thumbnails show embedded images, not rendered slides.
Select the two matching uses
Turn on Missing descriptions only. Check the boxes for slides 2 and 4. Confirm 2 selected. Selections persist across filters and pages; clear them before starting a different batch.
Apply one description to both
Enter the setup description below and choose Apply to 2 images. The two missing rows disappear from the filtered view. Turn the filter off to inspect them.
A terracotta pot holding one seedling sits on a wooden sill beside a window.
Try Undo
Choose Undo. Both descriptions return to empty and the edited count returns to zero. Reapply the setup text to the two selected pictures when ready.
Edit the other pictures individually
Click the slide 1 picture row to leave bulk selection, then apply the direction-of-growth description from the photo example. Do the same for the chart image on slide 3. Expect 4 edited; slide 5 remains decorative.
Download and review a new copy
Apply or discard any typed draft, then choose Download new copy. The editor adds -descriptions to the filename. Your source file stays unchanged. Compare your descriptions with the completed example and follow the review checks below.
03 / RECOGNIZE WHAT NEEDS REVIEW
Empty and decorative are different states.
An informative picture with no description is unfinished. A decorative picture adds no information needed to understand the slide. That decision depends on the slide’s purpose.
In this exercise, slide 5 is only a pause for a question, and the repeated plant photo is explicitly marked decorative. In the editor, it is read-only and is not counted as missing.
04 / CHECK THE FIT
What this beta covers
The editor changes picture descriptions. It does not audit every part of a presentation or establish accessibility compliance.
Ordinary .pptx files
Use an unencrypted PowerPoint Presentation (.pptx). Legacy .ppt, macro-enabled .pptm, templates, encrypted or digitally signed packages, Strict Open XML, and ZIP64 are not accepted.
For a rejected file, work from a separate supported copy saved in PowerPoint if appropriate. Renaming its extension is not conversion.
Slide picture occurrences
Pictures on slides, including those in ordinary groups, are listed. Each occurrence can have its own description even when several occurrences share one embedded image.
Existing separate image titles and decorative flags are preserved. The editor does not overwrite the original file.
Some visuals stay outside the list
Native charts, SmartArt, shapes, text boxes, connectors, image fills, backgrounds, masters, layouts, notes, and alternate-content branches are outside scope.
A picture of a chart can be edited; a native PowerPoint chart cannot. Review the scope notes and the actual slides.
Previews have limits
PNG and JPEG images can have previews. Formats such as SVG, EMF, WMF, and GIF receive a labeled fallback. Linked external targets are not fetched; linked, missing, and audio/video poster pictures are read-only.
The thumbnail is the embedded image. It does not reproduce slide cropping, rotation, layering, animation, or surrounding text.
File, preview, and free-version limits
Up to 50 MiB compressed, 500 slides, and 1,200 picture occurrences. An otherwise small deck can still exceed a structural limit.
Up to 3,000 ZIP entries; 200 MiB expanded total; 32 MiB per part; XML limited to 4 MiB per part and 24 MiB total.
Image preview limits: 12 MiB, 16 megapixels, and 8,192 pixels on either side. A preview fallback does not itself mean the picture’s description is uneditable.
Descriptions may contain up to 12,000 characters. This is a software limit, not a recommendation for description length.
Slides 1–20 are free to edit. Every slide counts, including slides with no pictures. Later slides are visible but locked, and the download includes the entire deck.
A $4.99 one-time full version is planned. Payment and unlocking are unavailable; there is no checkout.
05 / FINISH IN POWERPOINT
Check the exported presentation before you share it.
Keep the original. Open the newly downloaded copy separately. If PowerPoint asks to repair it or content looks wrong, stop using that copy and keep the source.
Compare the slides. Check slide count, images, crops, grouping, charts, layout, and any later locked slides. The editor’s image previews cannot confirm visual equivalence.
Inspect the descriptions. Check the Alt Text pane for each edited occurrence, including repeated images. Verify decorative status and unedited occurrences too.
Review the rest of the presentation. Use PowerPoint’s Accessibility Checker and human review for reading order, meaningful titles, contrast, tables, media captions, and visuals outside this tool’s scope.
Testing with synthetic files is evidence for those cases, not a guarantee for every deck. A successful download or a cleared missing-description count does not mean the presentation is fully accessible.
06 / WHY NOW
Teaching at a public college? The ADA Title II dates moved.
The Department of Justice’s web accessibility rule for state and local governments, including public colleges and universities, now has compliance dates of April 26, 2027 and April 26, 2028, depending on the population of the government the institution belongs to. Read the sourced summary and the PowerPoint alt-text steps. It is not legal advice.